
CSIRO and AEMO just dropped their draft GenCost 2025-26 report, and for the first time, they're not just giving us technology-level LCOEs, they're publishing full system-level outcomes with explicit integration costs, firming requirements, and transmission buildout assumptions baked in. Average electricity cost of ~$90/MWh (including transmission) for an 82% renewable grid by 2030. Near-zero emissions systems by 2050 landing in the $130-150/MWh range depending on firming mix, storage duration, and curtailment tolerance.
The thing that plenty of people seem to be missing is that this isn't just an update to the cost curves. It's a fundamental shift in what GenCost is trying to tell us, and it exposes questions about capacity adequacy, revenue sufficiency, and market design that are getting harder to avoid.
What's Actually Changed
Previous GenCost editions gave us technology-level LCOEs and capital cost trajectories: what it costs to generate a MWh from an individual asset under idealised operating conditions. Useful for apples-to-apples technology comparison, but they explicitly said "don't treat these as system costs, they don't account for integration, firming, or network augmentation." Everyone treated them as system costs anyway.
The 2025-26 draft finally addresses that by bundling everything together: generation mixes for defined decarbonisation pathways, firming capacity to cover VRE variability, storage capacity and duration assumptions, curtailment of surplus energy, transmission investment required to spatially balance supply and demand. They're giving us what the whole system costs to deliver reliable electricity, not just the marginal cost of energy from individual assets.
And here's what's interesting—the technology-level numbers haven't dramatically shifted. Solar and wind are still cheapest on a standalone LCOE basis. Battery CAPEX is still falling in double digits, particularly for Li-ion systems in the 2-4hr duration range. Gas and nuclear are still expensive on a $/MWh basis once you account for low capacity factors and capital recovery over limited operating hours.
What's changed is that now we can see what happens when you actually try to build a reliable grid out of these pieces with defined reliability standards and emissions constraints. And the answer is: it costs more than the LCOE of solar panels, but it's still materially cheaper than building the system around gas peakers or nuclear baseload once you levelise everything properly.
Figure 1: System-Level Electricity Cost Outcomes
System-level electricity costs from GenCost 2025-26 draft for defined decarbonisation pathways, including generation, firming, storage, and transmission.
Note: System costs represent aggregated portfolio outcomes, not individual technology costs or price forecasts.
Source: GenCost 2025-26 Draft (CSIRO-AEMO)
The Technology Picture
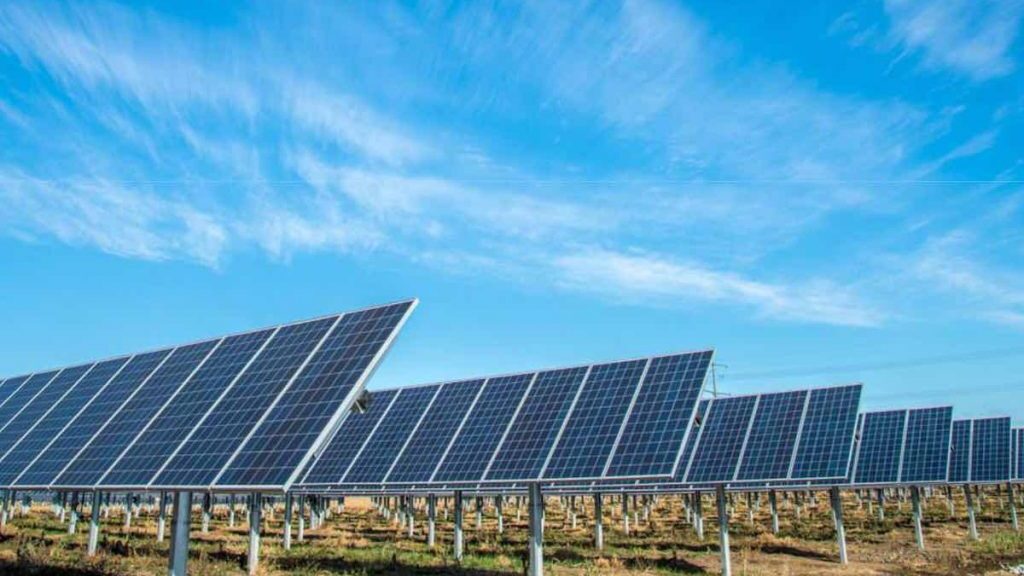
Solar PV (utility-scale): Still one of the lowest-cost options at ~$40-55/MWh LCOE, assuming capacity factors of 25-30% and 30-year economic life. But for the first time in years, installed CAPEX went up year-on-year. Not because of module pricing—those are still soft globally—but because of balance-of-plant costs. Electrical and civil BOP, labour rates, construction risk premiums. The globalised cost decline story driven by polysilicon and cell manufacturing is over; now it's about how efficiently we can deliver civil works, HV switchyards, and grid connection infrastructure locally.
Wind (onshore): Sitting around $50-70/MWh LCOE with capacity factors of 35-45% and 30-year economic life, after a brutal inflation spike post-COVID in turbine nacelles, tower fabrication, foundations, and logistics. Costs have stabilised in the draft, but they're not coming back down to where they were pre-2021. The step-change increase in turbine CAPEX, civil works, and construction labour has been largely locked in.
Batteries (2-4hr duration): Still seeing double-digit cost reductions in the draft. Round-trip efficiency around 85-90%, economic life of 10-15 years for cells with longer asset life for inverters and BOP. These are getting cheaper fast, but here's the catch: their cost-effectiveness is entirely system-dependent and highly sensitive to assumed cycling behaviour, depth-of-discharge profiles, and the value of time-shifting energy vs providing synthetic inertia and fast frequency response. A battery's LCOE means nothing without knowing utilisation assumptions and what ancillary services it's being dispatched for.
Gas (OCGT vs CCGT): This is where it gets interesting. OCGTs are sitting at $120-160/MWh LCOE with assumed capacity factors in low single digits to ~10%. CCGTs at $90-120/MWh, but with capacity factors materially lower than historical baseload operation as they're increasingly relegated to peaking and firming roles. And those $/MWh numbers are climbing, not because fuel costs are spiking, but because as VRE penetration increases, thermal dispatch gets squeezed into fewer operating hours. You're recovering the same fixed CAPEX, financing costs, and O&M over less energy throughput, so the levelised cost climbs even if absolute capital cost and fuel assumptions are stable.
Nuclear (large-scale Gen III/III+): Consistently sits around $120-170/MWh LCOE in the draft, with the lower end overlapping with CCGT territory. Assumes capacity factors >85% and economic life of 60+ years, but dominated by upfront CAPEX intensity, financing costs over extended construction periods (typically 10+ years), and construction risk rather than fuel cycle costs. Overnight capital costs are the primary driver. Once you're financing $6-8 billion for 10-15 years before first revenue, the WACC burden becomes enormous even at investment-grade rates.
Here's what's worth sitting with for a moment: nuclear and gas are in roughly the same levelised cost envelope once you account for realistic capacity factors and capital recovery. But gas features prominently in every transition plan, ISP scenario, and policy discussion as a firming and reliability option, while nuclear gets excluded from consideration entirely in Australia's system planning.
GenCost doesn't model a nuclear-enabled system or attempt NPV optimisation across different firm generation portfolios, so we can't read too much into this. But the numbers do suggest that nuclear isn't absent from the conversation because it's uniquely expensive in generation cost terms on a $/MWh basis. It's absent because of delivery timelines (first power 2040+ at earliest), institutional capability gaps, current policy settings under EPBC and state legislation, and social licence, not because the LCOE screams that it's obviously economically irrational compared to gas CCS or hydrogen-fired generation.
Figure 2: Technology-Level LCOE Ranges
Technology-level levelised costs from GenCost 2025-26 draft under assumed capacity factors and economic life.
Note: LCOE ranges reflect assumed capacity factors (CF) and economic life. Actual costs vary with site conditions, financing, and utilisation.
Source: GenCost 2025-26 Draft (CSIRO-AEMO)
Does Aggregation Change the Story?
The most common criticism of renewable cost analysis is that it makes solar and wind look artificially cheap by treating them in isolation and ignoring system integration costs. Low standalone LCOEs for VRE get quoted without accounting for the fact that the electricity system must meet instantaneous demand with adequate reserve margins, provide inertia and frequency control, and maintain voltage stability. Not just supply the right amount of energy on average across the year.
Fair criticism. The 2025-26 draft is the first time GenCost has tried to answer it directly by publishing aggregated system-level costs that explicitly include firming capacity, storage energy and power capacity, curtailment losses, and transmission augmentation.
So what happens when you bundle everything together?
You get approximately $90/MWh (including transmission) for an 82% renewable system by 2030. That's materially higher than the LCOE of solar (~ $40-55/MWh) or wind (~ $50-70/MWh) in isolation. But it's also materially lower than the levelised cost of building a system primarily around new-build gas generation with CCS or nuclear capacity, even accounting for their high capacity factors.
The system average reflects the weighted outcome of combining large volumes of very low-cost energy from VRE, smaller volumes of higher-cost firming and peaking capacity, storage with moderate $/MWh costs when levelised over cycling behaviour, losses from economic curtailment when VRE output exceeds instantaneous demand minus storage charging capacity, and network CAPEX required to spatially balance generation and load centres.
Aggregation compresses the cost distribution. It raises the apparent $/MWh of low-LCOE technologies when you add integration costs, and it lowers the apparent cost of high-LCOE thermal plants when you're only building enough to provide reliability rather than energy. But even with that compression, the system average still lands well below what you'd get building around firm generation as the dominant energy source.
Remove the cheap VRE energy that's setting the marginal price most hours, and the system average doesn't go down. It goes up. The aggregation exercise doesn't invert the cost stack. It narrows the gap between technologies, but renewables plus firming still comes out ahead of thermal-dominated systems on a system LCOE basis.
What aggregation does expose is risk concentration and sensitivity to assumptions at the margin. As VRE penetration increases, curtailment rises as a percentage of potential output, reducing effective capacity factors below theoretical maximums. Firming assets see lower capacity factors, pushing their $/MWh up as fixed costs get recovered over fewer MWh. Storage duration requirements increase for multi-day weather events, and longer-duration storage has materially higher $/MWh costs. System costs become highly sensitive to reliability standards (e.g. LOLE targets, peak demand assumptions under 1-in-10 or 1-in-20 weather conditions).
At this point, small changes in assumptions around storage duration (2hr vs 4hr vs 8hr portfolios), reliability standards (USE targets, reserve margins), or the availability of demand-side flexibility can move average system cost by $10-20/MWh without touching the underlying technology CAPEX or LCOE curves.
That's not a failure of renewables. It's a feature of building a system around variable resources where the marginal cost of reliability gets expensive fast once you're chasing the last few percentage points of adequacy. And that dynamic exists regardless of technology choice. It's just more visible in high-VRE systems because the marginal unit of firm capacity runs so few hours.
GenCost's aggregation exercise makes something explicit that was always true but easy to ignore: past ~80% renewables, you're not really paying for energy anymore. You're paying for reliability, adequacy, and the option value of dispatchable capacity that might only run a handful of times per year but absolutely has to be there when you need it.
Figure 3: Conceptual Framework - Technology Costs to System Outcomes
Illustrative decomposition showing major cost components in aggregated system outcomes. Values are conceptual and represent relative contributions, not additive components.
Note: Illustrative only. Components are interdependent and not strictly additive. Actual system costs depend on portfolio optimization.
Source: Conceptual framework based on GenCost 2025-26 Draft (CSIRO-AEMO)
Figure 4: System Cost Sensitivity to Key Assumptions
Variation in system costs across different portfolio configurations for comparable renewable penetration levels.
Note: Scenarios illustrate cost variation across different assumptions for similar renewable penetration (~82%).
Source: Scenario analysis framework based on GenCost 2025-26 Draft (CSIRO-AEMO)
Are Market Prices Doing the Job?
Here's where it gets uncomfortable. Observed wholesale energy prices in the NEM over the past decade have averaged roughly $70-100/MWh depending on region and period, with significant volatility driven by fuel costs (particularly gas), thermal outages, transmission constraints, and weather-driven demand and VRE output variations. FCAS revenues have become a material component of the total revenue stack for flexible assets. Batteries are now earning 40-50% of revenue from FCAS in some quarters. But FCAS prices and energy spreads are both trending down as more storage capacity competes for the same services.
GenCost's system estimate for an 82% renewable grid is ~$90/MWh including transmission. On one level, that looks broadly consistent with observed average prices once you account for regional and temporal variation. On another level, it highlights how little margin exists once you factor in volatility, risk premiums required to attract merchant investment, and the cost of capital for long-duration assets with uncertain revenue profiles.
The problem isn't average price. It's revenue distribution and timing. As VRE penetration increases, we're seeing exactly what you'd expect in an energy-only market with high penetrations of zero-marginal-cost generation. Average energy prices get suppressed during periods of high VRE output (negative prices are increasingly common in SA and QLD during midday solar peaks). Price spikes become more extreme during tight supply conditions but less frequent (volatility is concentrating into fewer intervals). Dispatchable assets (gas peakers, batteries providing energy arbitrage, pump hydro) are expected to recover their fixed costs from fewer high-priced dispatch intervals.
This works in theory. Energy-only markets are designed around scarcity pricing, where the value of reliability gets revealed through price formation during tight conditions. In practice, it means revenue certainty is collapsing for merchant assets. A gas peaker that runs 50 hours per year at $300/MWh might recover the same total revenue as one that historically ran 500 hours at $80/MWh, but the financing risk profile is completely different.
Policy mechanisms like the Capacity Investment Scheme (CIS with its revenue floor and ceiling structure), long-term underwriting arrangements, and capacity payments in the WEM (where energy and capacity revenues are explicitly separated and capacity gets paid ~$20-30/MWh system equivalent) don't materially reduce the underlying cost of generation or storage. What they do is reshape the revenue profile, shifting risk away from individual projects and toward consumers (through regulated charges) or governments (through underwriting exposure).
Seen through this lens, many recent policy interventions aren't really about making the system cheaper. They're about making the cost recoverable in a market structure that's increasingly struggling to deliver revenue certainty to the assets we need for reliability.
If anything, the comparison between GenCost's system costs (~$90/MWh) and observed average market prices ($70-100/MWh) suggests that average prices might be broadly sufficient at the system level, but the market as currently designed (particularly the NEM's energy-only structure) won't naturally deliver those revenues with adequate certainty to support the volume of investment required without continued and escalating policy intervention.
The question isn't whether the energy transition is affordable at ~$90/MWh. It's whether energy-only markets can actually deliver that outcome once you account for how revenue gets distributed across assets with radically different capacity factors, dispatch patterns, and risk profiles. And increasingly, the answer looks like "not without substantial market design changes or persistent policy support mechanisms."
Figure 5: Historical NEM Wholesale Prices vs GenCost System Costs
Historical NEM wholesale price ranges compared to GenCost 2025-26 system cost estimates.
Note: Historical prices are illustrative regional averages (energy only, excluding FCAS and network charges).
Source: NEM historical data (illustrative); GenCost 2025-26 Draft (CSIRO-AEMO)
What This Actually Tells Us
The draft GenCost 2025-26 report doesn't overturn the fundamental cost advantage of VRE on a system LCOE basis. It doesn't make firm generation suddenly cheap or economically attractive as the dominant energy source. And it doesn't resolve the harder questions of market design, revenue adequacy, or how investment risk gets allocated across different asset classes with radically different dispatch profiles.
What it does is make those questions impossible to ignore, particularly for anyone involved in system planning, policy design, or making actual investment decisions.
Energy itself is cheap. Solar and wind remain the lowest-cost sources of new generation on a $/MWh basis, and their cost trajectories remain favourable over the long term even with recent BOP inflation. Batteries are getting cheaper fast, and their ability to provide both energy arbitrage and fast frequency services makes them increasingly valuable for system integration.
But firm energy (dispatchable capacity that can run when it's needed regardless of weather conditions) is expensive regardless of which technology you choose. Once capacity factors drop below ~30-40% or overnight capital costs exceed $2-3 million per MW, levelised costs converge across very different technologies. Gas peakers, nuclear baseload, long-duration storage, hydrogen-fired generation all end up in similar $/MWh territory once you account for realistic utilisation and capital recovery requirements. GenCost makes that explicit in the technology-level numbers, even if it doesn't explore the system design implications or attempt to optimise firm capacity portfolios.
The central challenge isn't average system cost. It's risk allocation and revenue certainty at the asset level. The system costs that GenCost implies (~$90/MWh for 82% VRE, $130-150/MWh for near-zero emissions) aren't wildly inconsistent with what we're observing in wholesale markets when you average across regions and time periods. What's increasingly misaligned is how revenue gets delivered to individual assets, particularly dispatchable capacity that's needed for reliability but runs very few hours.
In an energy-only market like the NEM, that revenue is supposed to come from scarcity pricing during tight supply conditions. As VRE penetration increases and average prices fall while volatility concentrates into fewer intervals, that mechanism is under strain. Assets are expected to recover more cost from less energy, which works mathematically but creates financing risk that merchant investors increasingly won't accept without revenue floors, capacity payments, or long-term underwriting.
Policy interventions like CIS, capacity mechanisms, and long-term PPAs don't change the underlying system cost. But they fundamentally change who bears the revenue risk, shifting it from project investors to consumers (through regulated charges) or governments (through underwriting exposure). That's not necessarily wrong, but it's worth being explicit about what's happening.
None of this suggests the transition is unaffordable at ~$90-100/MWh for high-VRE systems. It does suggest that cost debates framed purely in terms of system average $/MWh are increasingly missing the point. If GenCost is evolving from a technology cost reference into a system outcomes framework, the conversation needs to evolve with it.
The focus should shift away from whether technologies X or Y are "cheap" in isolation, and toward how reliability and adequacy get procured as firm generation capacity factors collapse, how revenue risk gets allocated between consumers, governments, and private capital, how marginal costs of reliability get recovered when the last 10% of adequacy might cost 2-3x the system average, and whether energy-only market structures can actually deliver the investment signals we need, or whether we're headed toward capacity markets, strategic reserves, or hybrid models regardless of what the technology-level LCOEs say.
That's not a question GenCost can answer on its own. It's a cost reference, not a market design tool. But the draft makes clear that these are now the questions that matter far more than whether solar is $45/MWh or $55/MWh or whether wind costs went up 10% year-on-year.
The technology costs are largely settled. The market design questions are wide open.